Prometheus in TiDB: Metrics and Query Interpretation
1. What Prometheus is good at
Prometheus is excellent for operational monitoring, alerting, and trend analysis.
It is not intended for strict billing-grade accounting where 100% event completeness is required.
Core strengths:
- Time-series data model with metric + labels
- Powerful query language (PromQL)
- Flexible visualization (Grafana)
- Strong ecosystem of exporters and integrations
2. Data model refresher
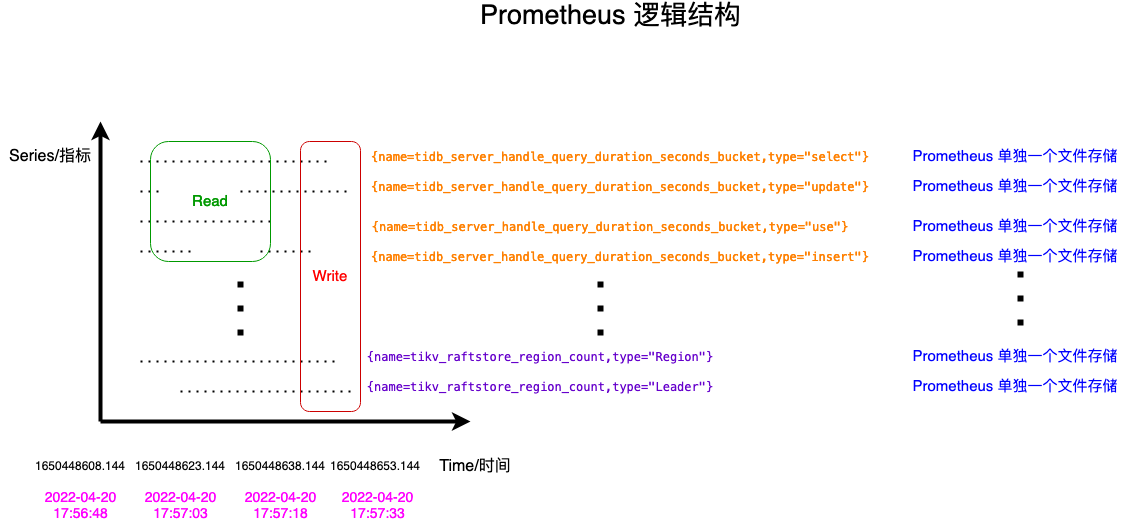
Prometheus stores data as time series:
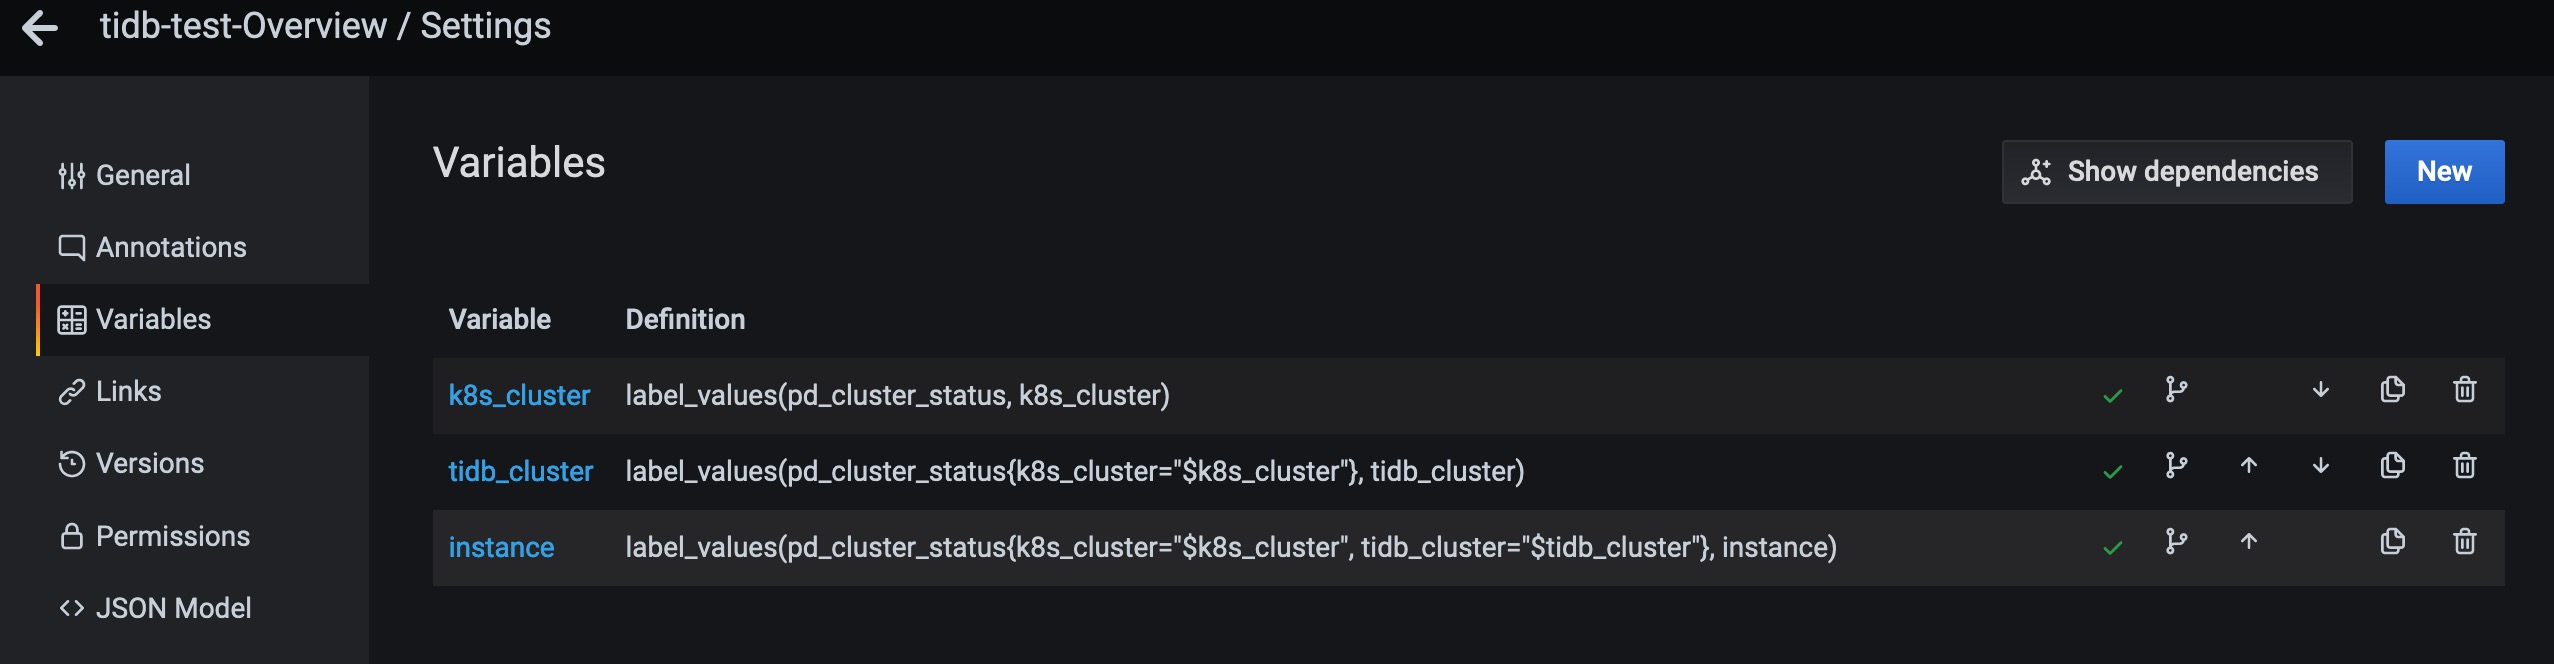
<metric_name>{label_1="v1", label_2="v2", ...} -> (t0, v0), (t1, v1), ...Example dimensions in TiDB metrics often include:
instancejobsql_typele(histogram bucket upper bound)
3. Time selectors in PromQL
3.1 Instant vector
Returns one sample per time series at evaluation time.
Example:
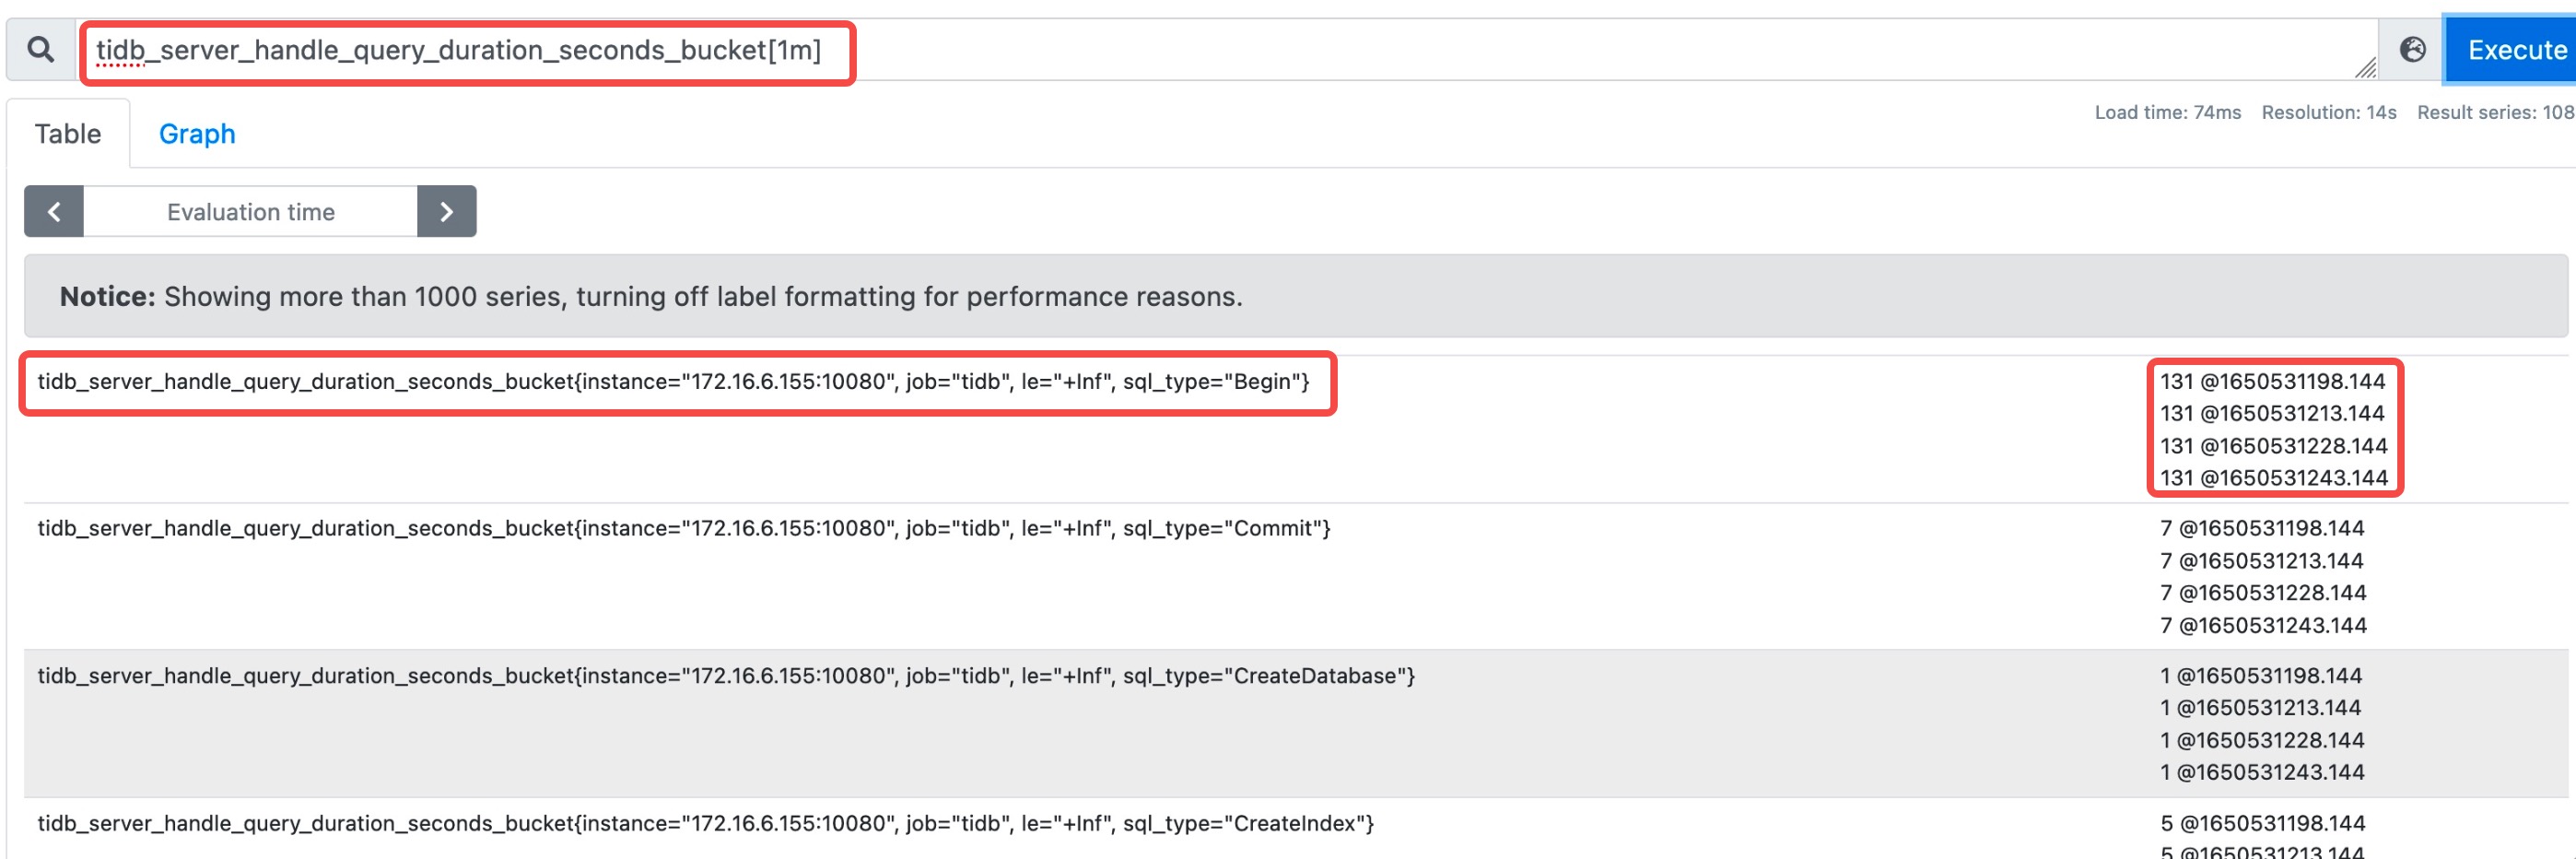
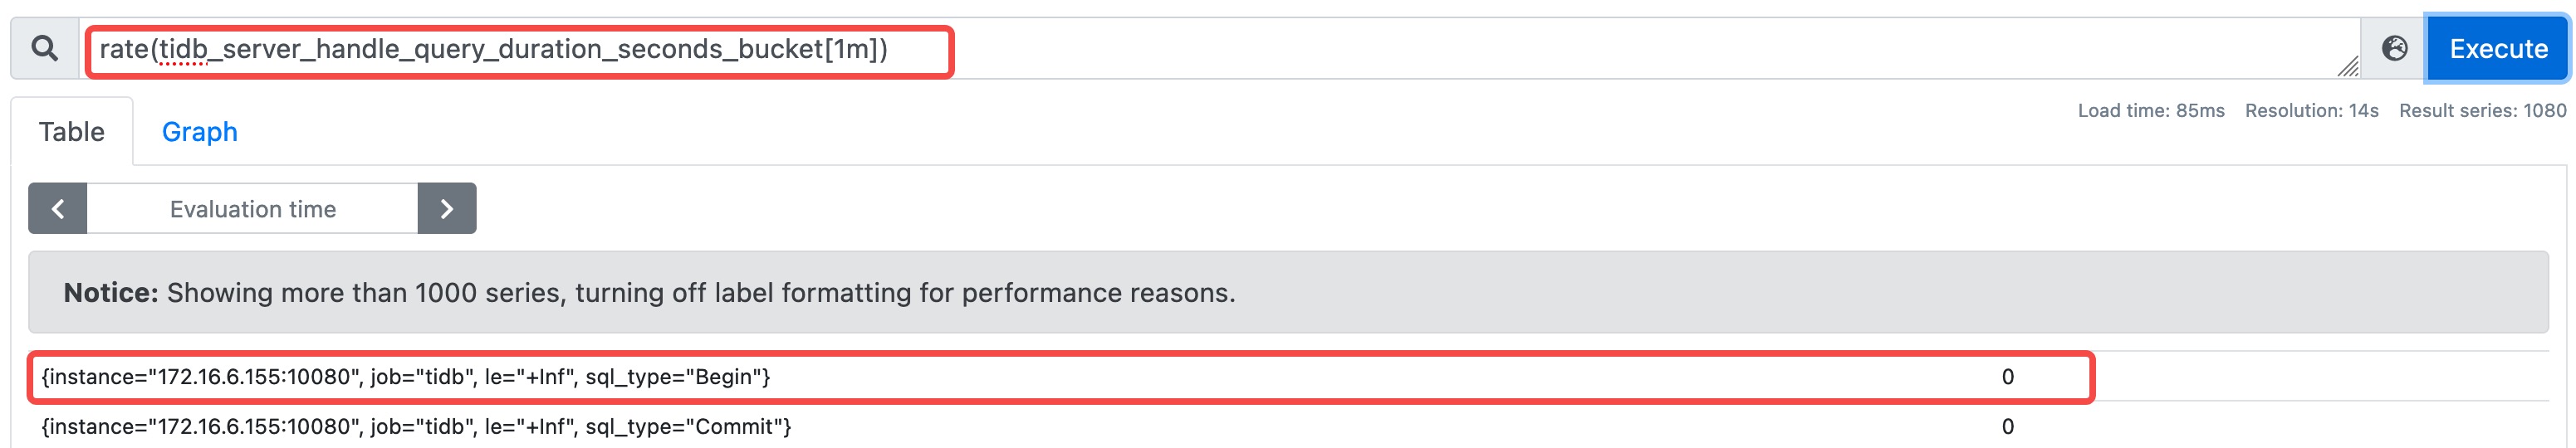
tidb_server_handle_query_duration_seconds_bucket{type="select"}3.2 Range vector
Returns all samples in a time window.
Example:
tidb_server_handle_query_duration_seconds_bucket{type="select"}[1m]3.3 Offset
Evaluates the same expression in a shifted time context.
Example:
tidb_server_handle_query_duration_seconds_bucket offset 5m4. Aggregation and rate functions
4.1 rate()
Use for average per-second increase over a range (commonly for counters).
4.2 increase()
Use for total increase over a range.
4.3 delta()
Difference between first and last sample in a range. Useful for gauges.
4.4 irate()
Per-second instant rate based on the last two points in a range.
4.5 histogram_quantile()
Computes quantiles (for example p99.9) from histogram bucket rates.
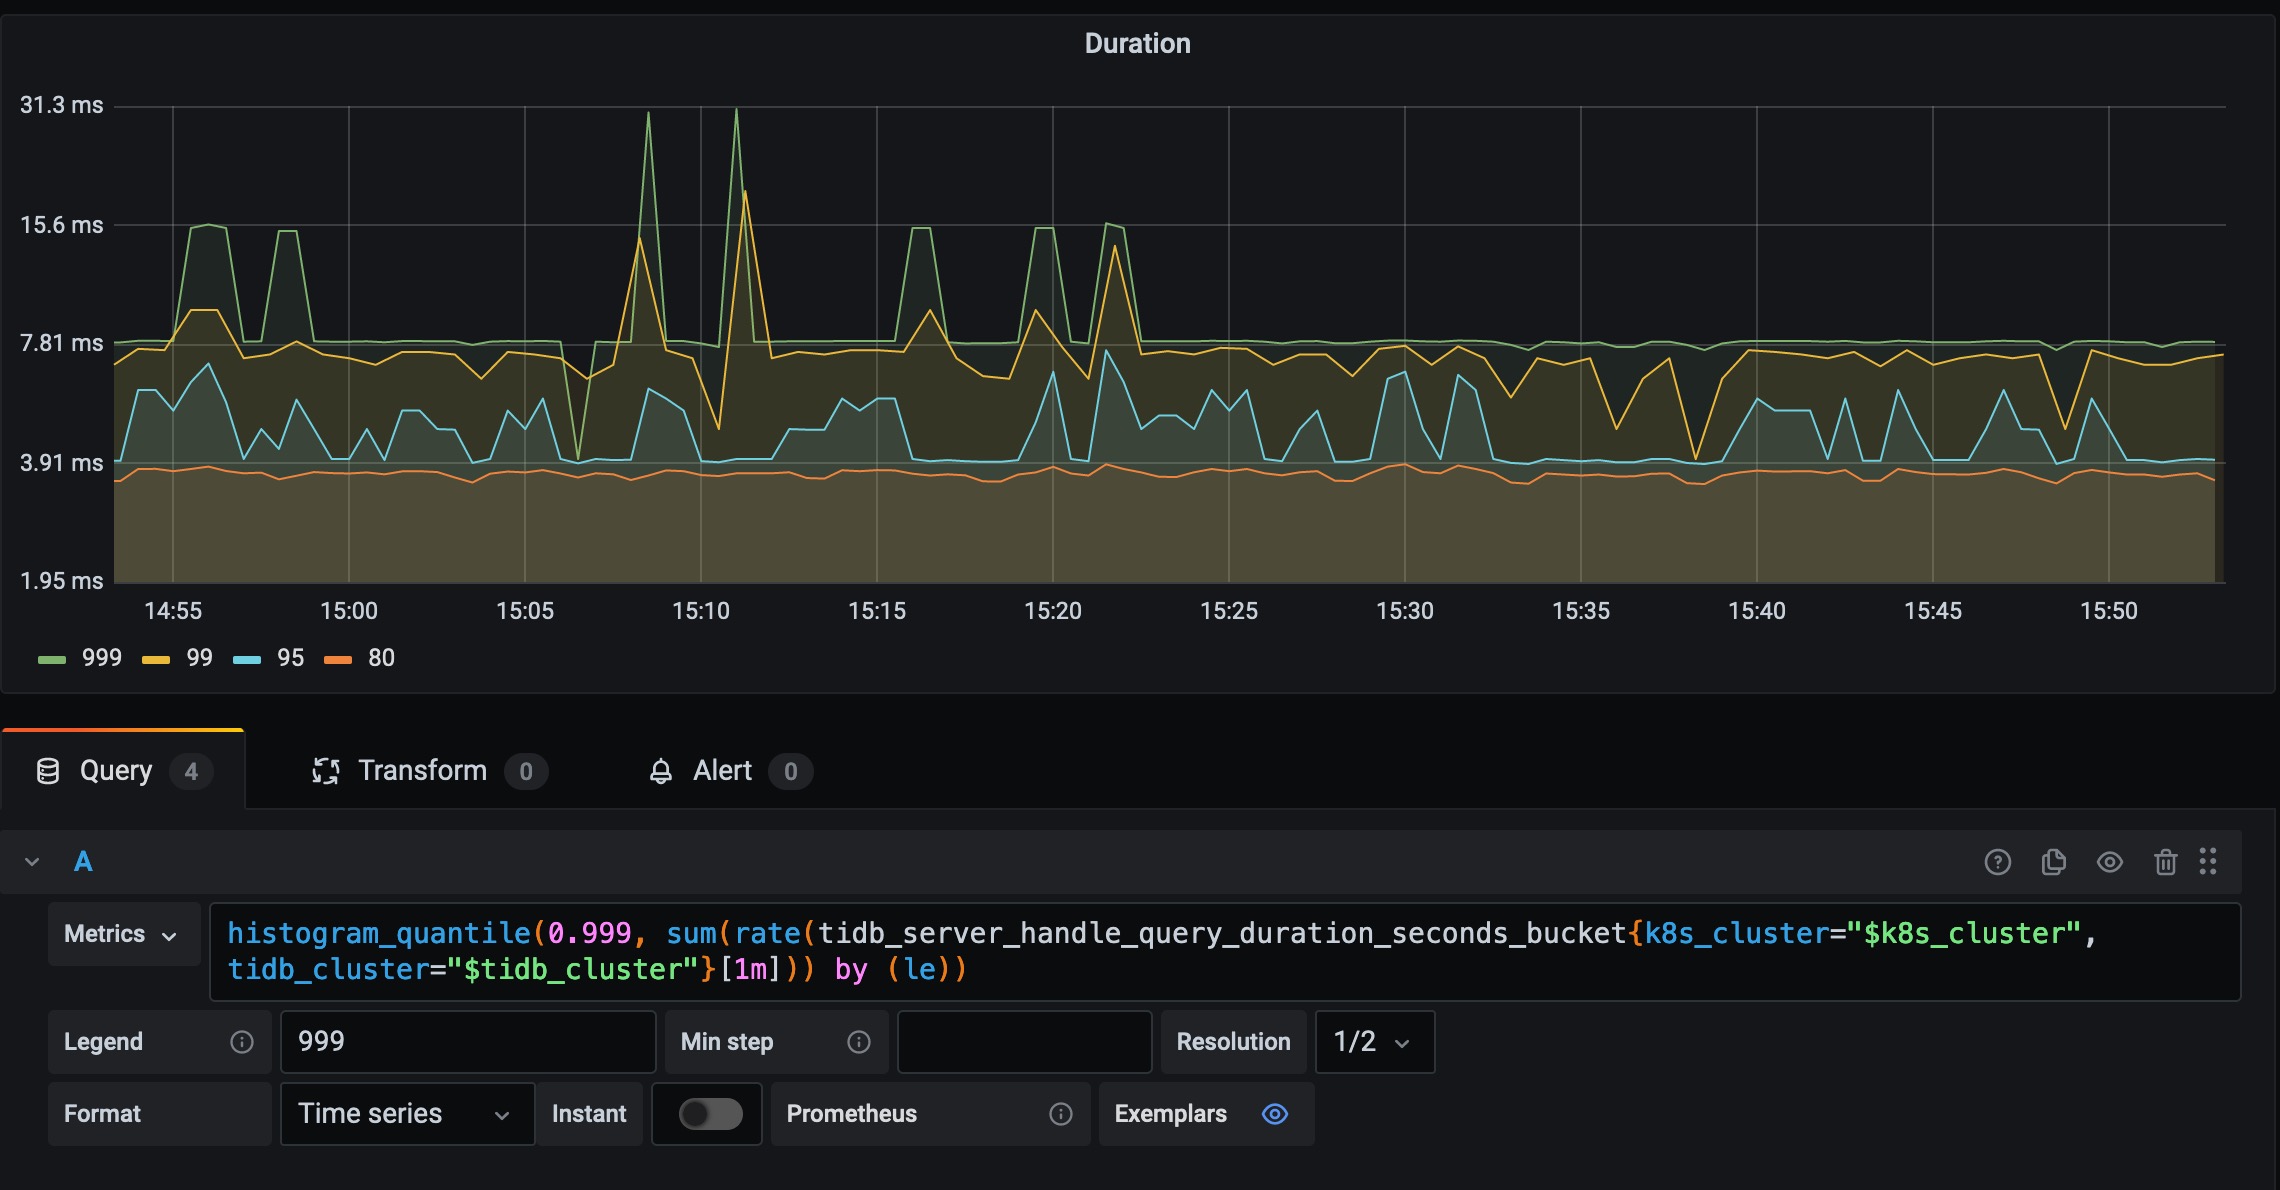
5. TiDB Duration p99.9 query breakdown
A common query in Grafana is:
histogram_quantile(
0.999,
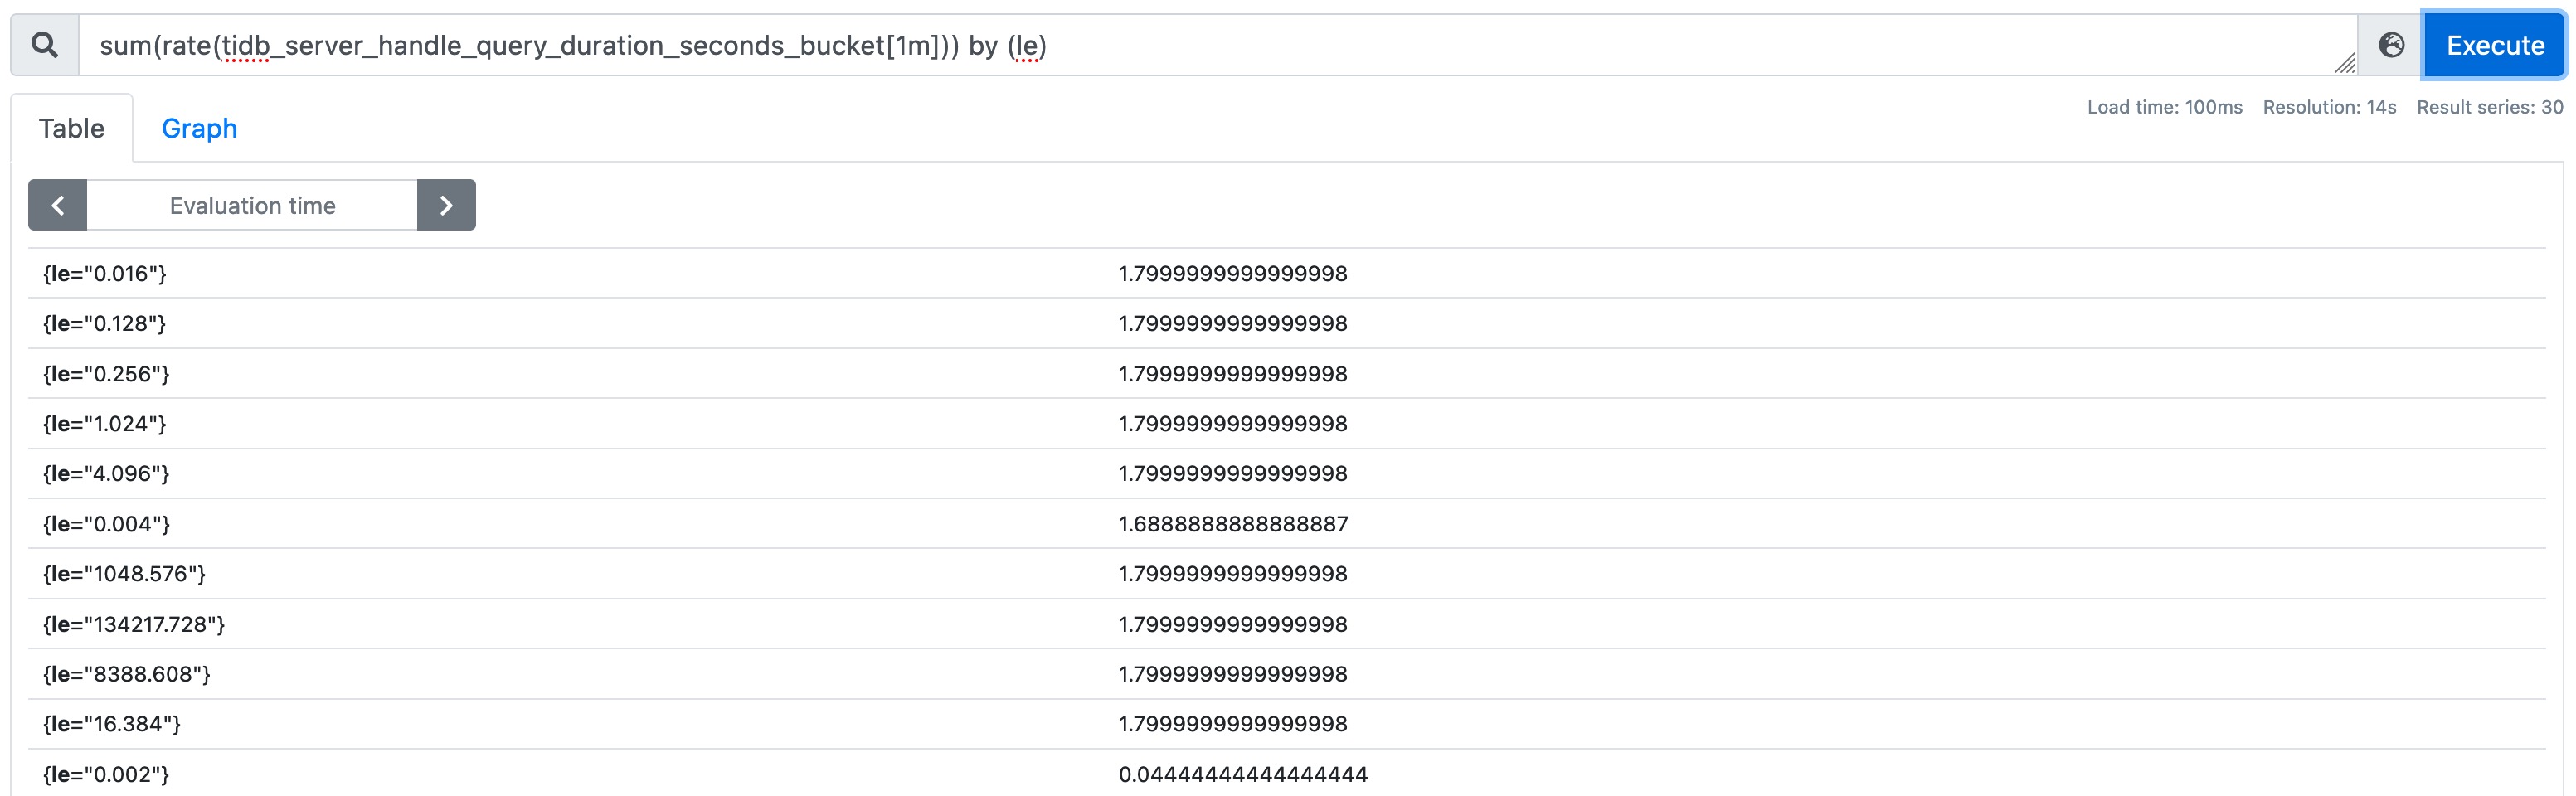
sum(rate(tidb_server_handle_query_duration_seconds_bucket[1m])) by (le)
)Interpretation pipeline:
...[1m]: collect bucket samples from the last minuterate(...): convert cumulative buckets to per-second bucket growthsum(...) by (le): merge across labels except bucket boundarylehistogram_quantile(0.999, ...): estimate p99.9 latency
Supporting visuals:
6. Metric types in practice
6.1 Counter
Monotonically increasing metric (except resets).
6.2 Gauge
Can increase or decrease.
6.3 Histogram
Stores sampled observations in buckets; useful for latency distributions.
6.4 Summary
Client-side quantile estimation.
In TiDB ecosystem practice, histograms are more commonly used for cross-instance quantile analysis in Prometheus + Grafana workflows.
7. Practical troubleshooting hints
When a latency panel rises unexpectedly:
- Verify whether increase is global or limited to a subset of
instance/sql_type - Check bucket shape changes (
le) before only reading one quantile line - Compare
rate()andincrease()views in the same window - Correlate with TiDB/TiKV resource metrics (CPU, IO, lock wait)