Parse Slow Log
Use the tihc tools slowlog command to parse TiDB cluster's slow query log files and asynchronously import them into any MySQL-compatible database for analysis.
Scenarios
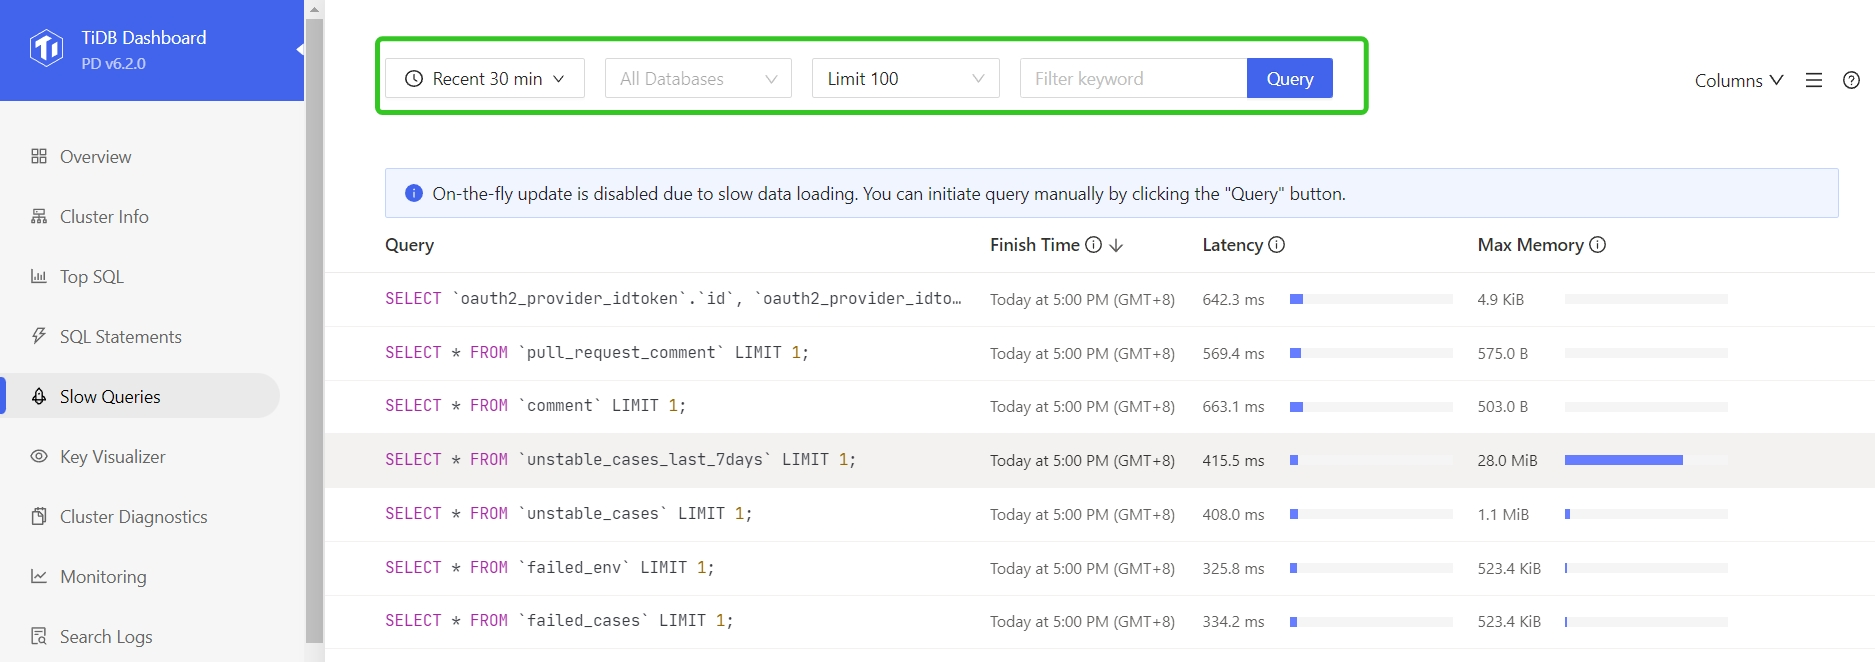
When analyzing TiDB performance issue, TiDB slow logs are crucial for performance analysis. Normally we can analyze slow queries using TiDB Dashboard , which provides a graphical interface for real-time slow query analysis:
In the following scenarios, a more flexible analysis approach is needed:
- Cannot access Dashboard
- Cannot connect to database to query information_schema.cluster_slow_query
- Need to analyze historical data offline
- Need complex statistical analysis (e.g., analyzing time distribution of specific slow SQL types)
The tihc tools slowlog command can parse slow query logs and import them into a database, enabling flexible SQL queries and statistical analysis.
Quick Start
- Prepare TiDB Cluster
curl --proto '=https' --tlsv1.2 -sSf https://tiup-mirrors.pingcap.com/install.sh | sh

source ${your_shell_profile}

tiup playground- Locate Slow Query Logs
cd /Downloads/tidb_slow_query-2025-03
ll
total 821464
-rw-r--r--@ 1 aric  staff   38140064  3 27 15:52 tidb.log
-rw-r--r--@ 1 aric  staff  314572718  3 26 00:57 tidb_slow_query-2025-03-25T16-57-07.979.log
-rw-r--r--@ 1 aric staff 67874170 4 7 17:27 tidb_slow_query.log- Parse and Import Slow Logs
tihc tools slowlog \
    --host 127.0.0.1:4000 \
    --log-dir /Downloads/tidb_slow_query-2025-03 \
    --pattern "tidb_.*.log"
==================================================
Command: slowlog
Status: Success
Duration: 15.974513708s
==================================================- Check Import Results
aric@MacBook Downloads % mysql --comments --host 127.0.0.1 --port 4000 -u root

mysql> use tihc

mysql> show tables;
+--------------------+
| Tables_in_tihc     |
+--------------------+
| CLUSTER_SLOW_QUERY |
+--------------------+
1 row in set (0.00 sec)

mysql> select count(*) from CLUSTER_SLOW_QUERY;
+----------+
| count(*) |
+----------+
|    88522 |
+----------+
1 row in set (0.03 sec)- Analyze Slow Queries
Example: Analyzing time distribution of a specific SQL by its digest:
SELECT
    DATE_FORMAT(Time, '%Y-%m-%d %H:00:00') as hour_time,
    COUNT(*) as frequency,
    AVG(Query_time) as avg_query_time,
    MAX(Query_time) as max_query_time,
    MIN(LEFT(Query, 20)) as query_sample
FROM tihc.CLUSTER_SLOW_QUERY
WHERE
    Digest = '12aee6550cdb84e9b42b0bdafff971ed4f4917faa7509129c56a0341fc127050'
GROUP BY
    DATE_FORMAT(Time, '%Y-%m-%d %H:00:00')
ORDER BY
    hour_time ASC;

+---------------------+-----------+---------------------+----------------+----------------------+
| hour_time           | frequency | avg_query_time      | max_query_time | query_sample         |
+---------------------+-----------+---------------------+----------------+----------------------+
| 2025-03-18 21:00:00 |        19 |  0.4493804775789474 |    0.606918439 | select user_id,base_ |
| 2025-03-19 18:00:00 |         4 |          0.32581528 |    0.338701305 | select user_id,base_ |
| 2025-03-19 21:00:00 |         5 |        0.3377161814 |     0.34657984 | select user_id,base_ |
| 2025-03-20 02:00:00 |         3 |          0.33664294 |    0.355553451 | select user_id,base_ |
| 2025-03-20 13:00:00 |         1 |         0.314235047 |    0.314235047 | select user_id,base_ |
| 2025-03-20 18:00:00 |         1 |          0.47384816 |     0.47384816 | select user_id,base_ |
| 2025-03-20 23:00:00 |         2 |         0.344667988 |    0.360696473 | select user_id,base_ |
| 2025-03-22 15:00:00 |         1 |         0.325766261 |    0.325766261 | select user_id,base_ |
| 2025-03-22 19:00:00 |         1 |         0.364963524 |    0.364963524 | select user_id,base_ |
| 2025-03-24 11:00:00 |         6 | 0.35267484299999996 |    0.387675187 | select user_id,base_ |
| 2025-03-25 15:00:00 |         5 |  0.5252397500000001 |    0.550156766 | select user_id,base_ |
| 2025-03-26 10:00:00 |         1 |         0.303821168 |    0.303821168 | select user_id,base_ |
| 2025-03-26 15:00:00 |        19 |  2.3894580074210525 |    3.486571348 | select user_id,base_ |
| 2025-03-26 16:00:00 |        12 |  1.6510478335833334 |    1.736003024 | select user_id,base_ |
| 2025-03-26 17:00:00 |        24 |  0.7259553074999999 |    1.322673489 | select user_id,base_ |
| 2025-03-26 18:00:00 |        22 |  1.9133352314545455 |    3.009928439 | select user_id,base_ |
| 2025-03-26 19:00:00 |        12 | 0.35154566491666667 |    0.505610509 | select user_id,base_ |
| 2025-03-26 20:00:00 |         9 |  2.3434320862222227 |    2.374194282 | select user_id,base_ |
| 2025-03-26 21:00:00 |        96 |  1.9793197923125003 |    5.519375406 | select user_id,base_ |
| 2025-03-26 23:00:00 |        39 |  1.4582763911025642 |    2.269301483 | select user_id,base_ |
| 2025-03-27 00:00:00 |        34 |  0.8496621455294118 |    1.047704387 | select user_id,base_ |
| 2025-03-27 01:00:00 |        16 |     0.8533504235625 |    2.043561618 | select user_id,base_ |
| 2025-03-27 02:00:00 |        13 |  1.5850548099230768 |      1.6326255 | select user_id,base_ |
| 2025-03-27 03:00:00 |        40 |  1.6741900960500005 |    1.825635187 | select user_id,base_ |
| 2025-03-27 05:00:00 |        29 |  1.4251187663793108 |    1.882324567 | select user_id,base_ |
| 2025-03-27 06:00:00 |        12 |  0.5653918619166668 |    0.602165939 | select user_id,base_ |
| 2025-03-27 07:00:00 |        25 |  0.8880253696799998 |    1.409791623 | select user_id,base_ |
| 2025-03-27 13:00:00 |        12 |  0.6974716397499999 |    0.749698881 | select user_id,base_ |
| 2025-03-27 14:00:00 |        15 |  0.8890294175333332 |    0.939996461 | select user_id,base_ |
| 2025-03-27 15:00:00 |        54 |  1.9239673954629628 |    2.684070904 | select user_id,base_ |
+---------------------+-----------+---------------------+----------------+----------------------+
30 rows in set (0.09 sec)
Main Options
| Option | Description | Default Value |
|---|---|---|
-a, --host <HOST:PORT> | TiDB server address (e.g., 127.0.0.1:4000) | - |
-b, --batch-size <BATCH_SIZE> | Number of records to process in each batch | 64 |
-d, --database <DATABASE> | Target database name for importing slow query data | tihc |
-D, --log-dir <DIR> | Directory containing TiDB slow query log files | - |
-p, --password <PASSWORD> | TiDB password | "" |
-u, --user <USER> | TiDB username | root |
-t, --pattern <PATTERN> | Slow query log filename pattern (e.g., "tidb-slow*.log") | - |
--timezone <TIMEZONE> | Your timezone (e.g., UTC+8) for correct timestamp parsing | UTC |
-l, --log-file <LOG_FILE> | Log file path | tihc_started_at_*.log |
-L, --log-level <LOG_LEVEL> | Log level (trace/debug/info/warn/error) | info |
CLUSTER_SLOW_QUERY
The tihc.CLUSTER_SLOW_QUERY table corresponds to TiDB slow query log fields, except for the INSTANCE field which is not recorded in slow logs.
For more information, refer to: